How Australia’s 21 largest cities score for liveability

DATE
TYPE Prevention Centre News
An Australian Prevention Partnership Centre project has achieved two major milestones just halfway through its project timeline.
Benchmarking, monitoring, modelling and valuing the healthy liveable city, led by Professor Billie Giles-Corti, with Dr Lucy Gunn, Dr Melanie Davern and the Healthy Liveable Cities Team at RMIT University, launched the Australian Urban Observatory in February, followed by the release in March of a key series of liveability scorecards for 21 cities.
The Australian Urban Observatory (AUO) is an innovative digital platform translating data collected about nine major domains – liveability, walkability, social infrastructure, transport, food, access to alcohol, public open space, employment and housing – measured across 23 indicators.
“These nine domains of liveability relate to health and wellbeing outcomes and could inform future policy and how resources are allocated. This is key to creating healthy, liveable and sustainable cities,” says Dr Lucy Gunn, project co-lead.
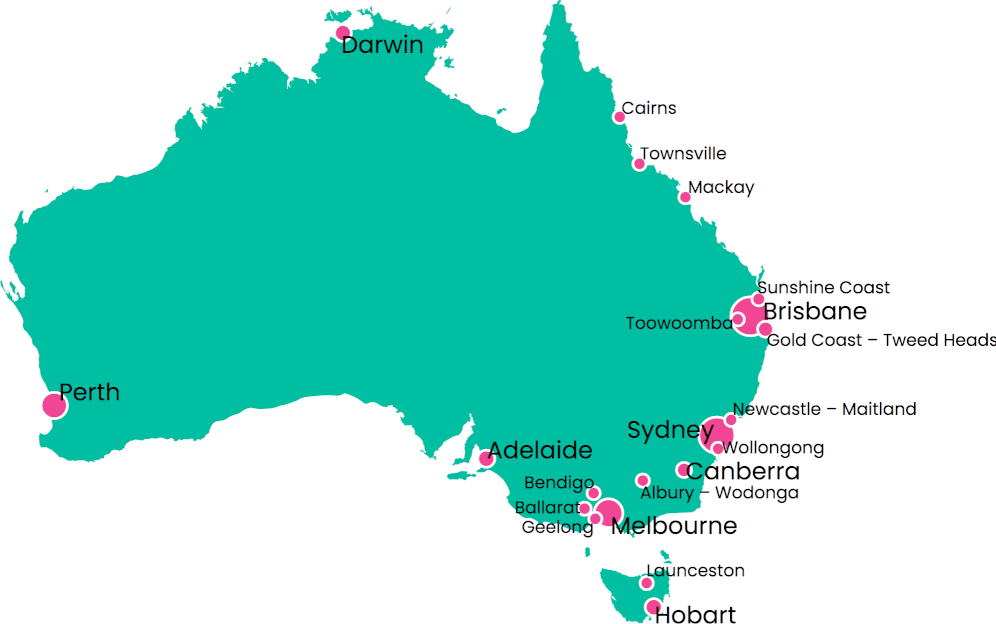
The scorecards reflect data collected from Australia’s 21 largest cities, cities which comprise around 20 million people, just under 80% of the population.
“The idea of the 20- and 30-minute city has become increasingly important to communities with research suggesting that living close to services has an impact on living conditions and the risk factors for chronic disease. Inequity in liveability is related to inequity in health,” says Dr Gunn.
The project team has worked closely with government agencies throughout.
“For example, changes to urban planning policies will also have an effect – co-benefit – on health.,” says Professor Billie Giles-Corti.
Already, the analytics of the Australian Urban Observatory website shows visits and interest from not just from state users, but also a national and even international audience.
Dr Melanie Davern, Director of the Australian Urban Observatory has been tracking the site analytics.
“We’ve been working closely with policy makers and governments for many years but having the AUO and the scorecards makes it easier for decision-makers to see the value of our liveability indicators and both within-city and between-city liveability differences. Our analytics so far are tracking very well.
“Since 16 March, the scorecards page is the most visited of all traffic to the AUO (after the homepage) with close to 2,000 visits to the site and over 6,600 pages viewed. The scorecards have been accessed over 1,200 times since mid-March.
“Countries using and accessing the AUO include Australia, USA, UK, India, Spain, Singapore, Japan, Finland, Netherlands, Austria, Germany, Denmark, and New Zealand.
“This shows that the platform and the scorecards are having real reach and impact, both here and internationally,” said Dr Davern.
“We’ve understood the association between the built environment and health outcomes, with the data supporting this. We have captured a huge amount of data and we’d now like to develop these into a series of policy-relevant indicators,” said Professor Giles-Corti.
What has become clear during the coronavirus pandemic is that liveability has become more of a consideration.
“As well as the coronavirus pandemic being a public health issue, we have seen that it also impacts on our daily management of business and people. I hope that we will remember the environmental benefits that took place, after the pandemic has ebbed.
“The impact of the coronavirus on communities shows just how important liveability is now that we’re in social isolation and unable to travel longer distances. The services in our local neighbourhoods – supermarkets pharmacies, groceries, health – are paramount at this time. For those who have easy access, life is infinitely easier which has a major impact on physical and mental health.
“We’ve all seen the photographs of cities with crisper skylines due to less pollution, quieter roads, more walking and cycling and how important green spaces have been in terms of physical and mental health during the crisis,” said Professor Giles-Corti.
All users of the Australian Urban Observatory, including those for the free Local Government Area indicators, need to register to access the portal. Sub-LGA indicators for suburbs and neighbourhoods are available to those who become AUO partners.
The project will be focusing on agent-based modelling as a major component of the project until its completion in 2021.
The project is supported by the NHMRC, Australian Government Department of Health, ACT Health, Cancer Council, and the Clean Air and Urban Landscapes Hub funded by the National Environment Science Program.
Australian Urban Observatory & Scorecards
- 21 Australian cities
- 20million people
- 80% of the population
- Nine major domains: liveability, walkability, social infrastructure, transport, food, access to alcohol, public open space, employment, housing
- 23 indicators
- Each scorecard report is 16 pages and downloadable